Better Insights with Excel Dashboards
Understanding your data is essential for making informed business decisions.
Dashboards are powerful tools that present data visually, making it easier to grasp key insights at a glance.
Why Use Excel Dashboards?
Microsoft Excel dashboards are designed to track and display performance metrics in real-time, allow businesses to make data-driven decisions, monitor progress and respond quickly to changes.
Whether you need to track sales, monitor website traffic, or assess financial health, Excel dashboards can be customized to serve a wide variety of purposes.
Benefits of Dashboards
Immediate insights
Interactive and simplified data analysis
Key business metrics on one page
Save time managing your data
Streamline updates with just a few clicks
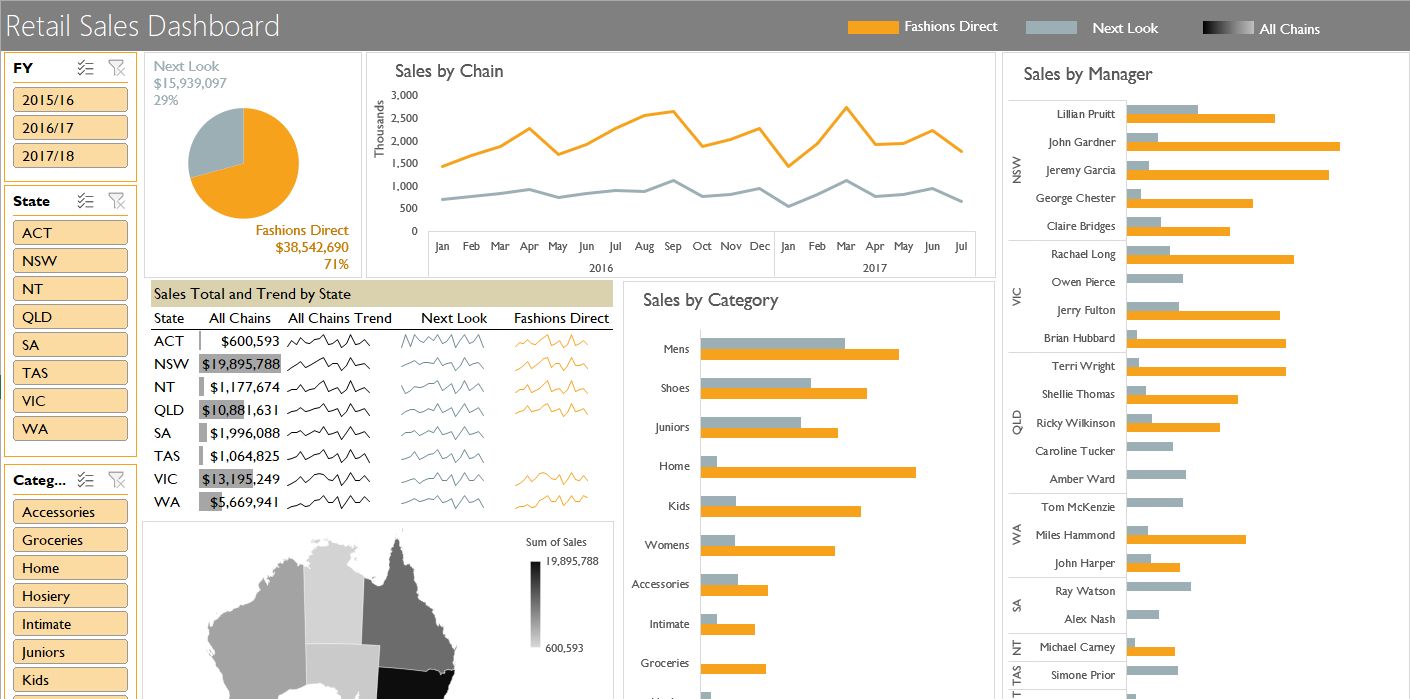
Example of an interactive Sales dashboards in Excel.
10 Reasons to Improve Your Data Insights with Dashboards
Microsoft Excel dashboards help to visualise and analyse data in a concise and interactive way. They are commonly used for business reporting and decision-making.
Data Visualisation
Dashboards allow you to present complex data in a more digestible, visual format. This could include charts, graphs, tables, and other visual elements that make trends and patterns more apparent.
Identifying Trends & Patterns
They help in identifying trends or patterns in data that might be hard to spot through raw numbers. Visual representations such as line charts, pie charts, and heatmaps make this process easier.
Tracking Metrics
Dashboards help in tracking a wide range of metrics such as sales performance, customer satisfaction, website traffic, financial performance, inventory levels, etc. This can all be done in one place for easy comparison.
Real-time Monitoring
Dashboards are often used to present real-time data or regularly updated data, providing immediate insights. This is particularly useful for ongoing operations that require timely decision-making.
Automation of Reports
Excel dashboards can automate data gathering and reporting, which saves time and reduces errors in manual reporting processes.
Performance Monitoring
They help monitor key performance indicators (KPIs) for a business or project. Managers can quickly assess whether the business is meeting its goals and where attention is needed.
Decision Support
Dashboards help you make informed decisions by providing key insights at a glance. This could include financial forecasting, resource allocation, and performance analysis.
Data Consolidation
An Excel dashboard can pull data from multiple sources, such as different worksheets or external databases, and consolidate them into one unified view.
Comparative Analysis
Dashboards often allow for comparisons between different datasets (like year-over-year, month-over-month, or even between different departments) to evaluate performance.
Interactive Filters and Controls
Dashboards in Excel can be made interactive with dropdowns, slicers, and filters. This allows users to focus on specific segments of the data (e.g., viewing data for a particular region or time period).